

When a smart meter transmits a reading, it does not send one number. A 15-minute interval AMI meter generates 96 data points per day — 35,040 reads per year, per meter. Each of those reads belongs to one of three distinct data types, and each type serves a different function in your billing engine, your operations center, and your anomaly detection workflow. Most utility professionals know they have meter data. Fewer can name the three types, or describe what their billing system does when one of them fails to arrive.
Meter data refers to the consumption and operational readings transmitted by a utility meter to a central management system. It falls into three primary categories: interval data, daily read data, and event data, each serving a distinct function in billing, operations, and anomaly detection. The quality and completeness of each data type directly determines billing accuracy downstream.
A utility meter does not generate data in isolation. Raw reads travel from the meter through a communication network : RF mesh, cellular, or power line carrier, to a head-end system operated by the AMI vendor. From there, a meter data management system receives those reads, processes them through validation and quality-control routines, and passes clean consumption data to the billing engine. What the MDM system receives from the head-end is not a single stream. It is three.
For a detailed walkthrough of how AMI infrastructure delivers meter data to the MDM layer, see how AMI data connects to your billing system.
Every modern AMI smart meter produces three categories of data, each transmitted on a different schedule and consumed by different parts of the utility operation:
1. Interval Data - high-frequency consumption readings collected at fixed time intervals, typically every 15, 30, or 60 minutes. The default output of a full-feature AMI deployment.
2. Daily Read Data - a single aggregated consumption figure transmitted once per day. Common in both AMR systems and basic AMI configurations. The foundation of standard monthly billing cycles.
3. Event and Alarm Data - non-consumption signals triggered by specific meter conditions: tamper detection, outage, reverse flow, continuous low-flow, and high-consumption alerts.
Table 1: Meter data types compared by collection frequency, billing use, storage implication, and failure consequence
Interval data refers to consumption readings collected at fixed, repeating time intervals — typically every 15, 30, or 60 minutes — by an AMI smart meter. At 15-minute granularity, a single meter generates 96 data points per day, compared to one monthly read produced by a traditional AMR system.
Interval data enables capabilities that a daily or monthly read cannot support:
1. Time-of-use billing — charging customers different rates for peak versus off-peak consumption periods requires sub-hourly read granularity. Monthly or daily reads cannot support rate structures that depend on when consumption occurred.
2. Demand charge calculation — commercial and industrial customers billed on peak demand require 15-minute interval reads to accurately identify peak consumption windows within each billing period.
3. Consumption pattern analysis — deviations from a customer's normal hourly profile flag potential leaks, tampering, or unbilled usage before the billing cycle closes, enabling proactive outreach rather than reactive dispute resolution.
4. Demand response programs — grid operators need interval data to dispatch demand response events and verify customer load reduction in real time against baseline consumption profiles.
For a step-by-step walkthrough of how AMI interval data travels from the smart meter network into the billing engine, see how AMI data connects to your billing system.
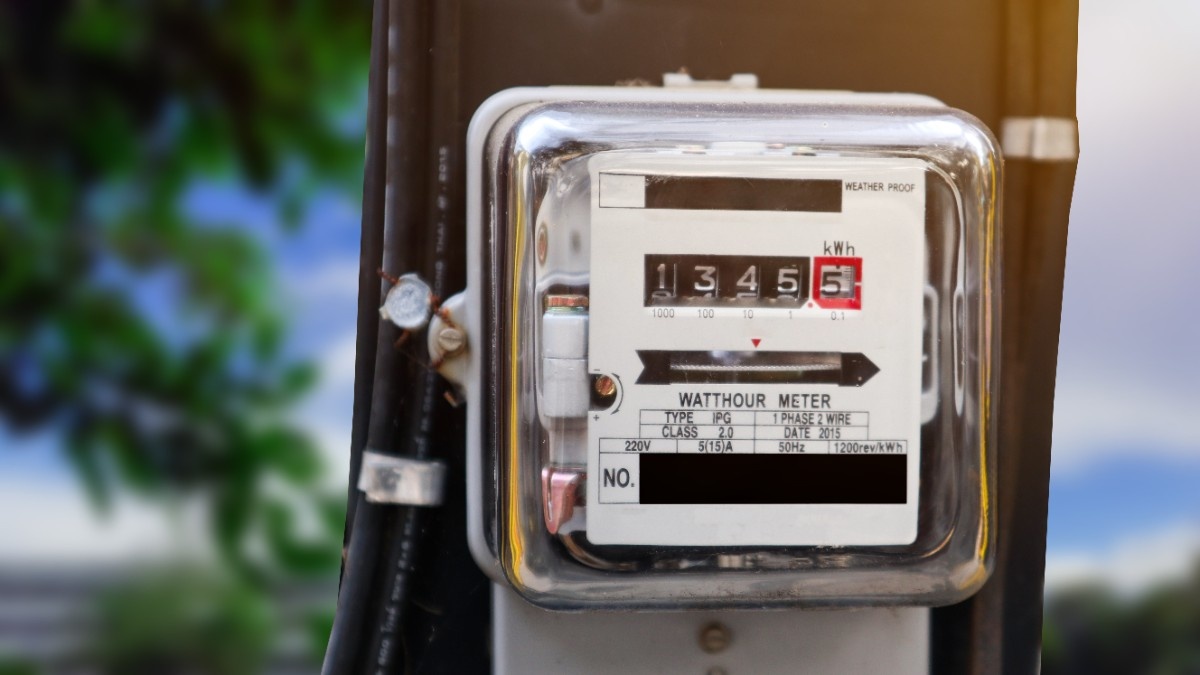
Daily read data refers to a single aggregated consumption figure, the total volume or energy consumed in a 24-hour period — transmitted once per day from the meter to the head-end system.
Daily reads remain the operational standard for most US municipal water utilities and for electric utilities still operating AMR infrastructure or basic AMI configurations without full interval capability. A daily read tells the billing system how much was consumed on a given date — sufficient for standard monthly billing, but insufficient for time-of-use rates, leak pattern detection, or demand response.
The billing cycle is built on daily reads. Most US municipal utility billing systems derive the monthly consumption figure by aggregating daily reads across the billing period. When daily reads fail to transmit, due to communication outages, meter hardware faults, or head-end configuration errors — the billing system falls back to an estimated read.
Estimated reads are the primary driver of billing disputes. Customers who receive an estimated bill higher than their actual consumption contest the charge, triggering manual re-reads, account adjustments, and customer service contacts that consume staff time and reduce satisfaction scores.
Event and alarm data refers to non-consumption signals transmitted by a smart meter in response to a specific detected condition. Unlike interval or daily read data — which are produced on a regular schedule — event data is triggered by what the meter detects at the point of measurement.
Common event types and what they signal:
1. Tamper events — the meter detects removal, physical tilt, or magnetic interference, signaling potential theft of service or unauthorized meter access requiring immediate field investigation.
2. Reverse flow — water or electricity is flowing backward through the meter, signaling a cross-connection, backflow issue, or an unregistered distributed energy resource in electric utility deployments.
3. Continuous low-flow — consumption is recorded at a consistent low rate without interruption over an extended period. This is the most reliable leak signature available directly from meter data, detectable before a customer reports water damage.
4. Outage detection — the meter loses power and transmits a last-gasp signal before going offline, enabling outage mapping and crew dispatch before customer calls arrive at the contact center.
5. High consumption alerts — consumption exceeds a configured threshold within a given interval, signaling a pipe burst, irrigation system malfunction, or potential theft of service.
The operational challenge with event data is not collection — most modern AMI meters produce it automatically. The challenge is actioning it. Event data feeds into the MDM system as a separate stream from consumption reads. Utilities that have not configured their MDM to route tamper events to the customer service team, or continuous low-flow events to the operations crew, collect the data without ever using it.
Every meter read, regardless of type, enters the billing engine via the same quality-control gateway: the VEE process. VEE refers to the three-step sequence of Validation, Estimation, and Editing that an MDM system applies to each incoming read before it is accepted into billing.
Validation checks whether a read is complete, plausible, and within expected parameters. Estimation generates a calculated substitute for any read that fails validation. Editing flags reads that fall outside acceptable ranges for manual review by billing staff.
Billing accuracy is a direct function of how many reads pass Validation without requiring Estimation. A utility where 5% of daily reads fail to transmit will generate estimated bills for 5% of customers every billing cycle and estimated reads are the primary driver of billing disputes, manual re-read requests, and revenue leakage across all three utility types.
Non-revenue water (NRW) — water that is produced, treated, and distributed but never billed — is partially a meter data quality problem. Consumption that goes unregistered due to meter malfunction, or that is registered but lost in a failed daily read transmission, does not appear in the billing engine and is never recovered as revenue.
A meter data management system (MDMS) is the software layer that sits between an AMI head-end system and a billing engine. It receives all three data types — interval reads, daily reads, and event signals — applies VEE processing, stores reads in a format the billing system can consume, and routes exception data to the appropriate operational team for action.
For a detailed breakdown of how an MDMS is architecturally structured, see what a meter data management system does. For the end-to-end AMI integration walkthrough, see how AMI data connects to your billing system.
SMART360 by Bynry is a cloud-native utility management platform with a purpose-built MDM module designed for US municipal water, electric, and gas utilities. Its MDM layer connects to AMI head-end systems via 25 or more pre-built integrations — including the most widely deployed AMI platforms in the US municipal market — eliminating the custom middleware development that most legacy billing system integrations require.
When a meter transmits an interval read, a daily consumption figure, or a tamper event, SMART360's MDM module receives it, runs automated VEE processing, flags exceptions for the billing team, and routes event data to the configured operational queue — without manual intervention from IT or billing staff.
For utilities replacing a legacy CIS or stand-alone billing system, SMART360 implements in 12 to 24 weeks — a timeline that accounts for data migration, integration configuration, and staff onboarding, not a minimum-case projection.
Island Water Authority reduced operational costs by 47% after implementing SMART360 — a result driven in part by eliminating manual meter read processes and consolidating meter data management, billing, and customer service into a single platform.
To see how SMART360 handles all three meter data types, visit the meter data management system feature page.
→ See How SMART360 Manages All Three Types of Meter Data
The three types of meter data are interval data (consumption readings collected every 15 to 60 minutes by AMI smart meters), daily read data (a single aggregated consumption figure transmitted once per day), and event and alarm data (non-consumption signals triggered by specific meter conditions such as tamper detection, reverse flow, or continuous low-flow). Each type serves a distinct function in billing accuracy, operational response, and anomaly detection.
Interval data refers to consumption readings collected at fixed, repeating time intervals, typically every 15, 30, or 60 minutes, by an AMI smart meter. A meter producing 15-minute interval reads generates 96 data points per day. Interval data enables time-of-use billing, demand charge calculation for commercial customers, and consumption pattern analysis for leak and tamper detection — capabilities that a single daily read cannot support.
Event data refers to non-consumption signals transmitted when a smart meter detects a specific condition at the point of measurement. Common event types include tamper detection, reverse flow, continuous low-flow (a direct leak signature), outage signals, and high-consumption alerts. Event data is automatically produced by most AMI meters but requires MDM system configuration to route it to the appropriate operational team for action.
Meter data quality determines billing accuracy because every consumption figure that reaches the billing engine first passes through VEE — Validation, Estimation, and Editing. When reads fail to transmit or fall outside expected parameters, the MDM system issues an estimated read. Estimated reads are the primary cause of billing disputes and revenue leakage at US municipal utilities. Utilities with automated VEE and complete data transmission report significantly fewer billing exceptions per billing cycle.
Bynry Inc.
8 The Green STE.R,
Dover, Kent,
Delaware 19901
+1 732-630-0285
Bynry Inc.
Serene Tower, Pakharbaug
Pune, Maharashtra 411021
+91 93252-51217