| Route | Meters | Faulty | Avg battery | Status |
|---|---|---|---|---|
| R-01 North | 4,120 | 38 | 86% | Healthy |
| R-02 Central | 6,540 | 112 | 71% | Watch |
| R-03 Harbor | 3,880 | 21 | 90% | Healthy |
| R-04 Ridge | 2,970 | 164 | 58% | Action |
Every Answer.
One Login, No Waiting.
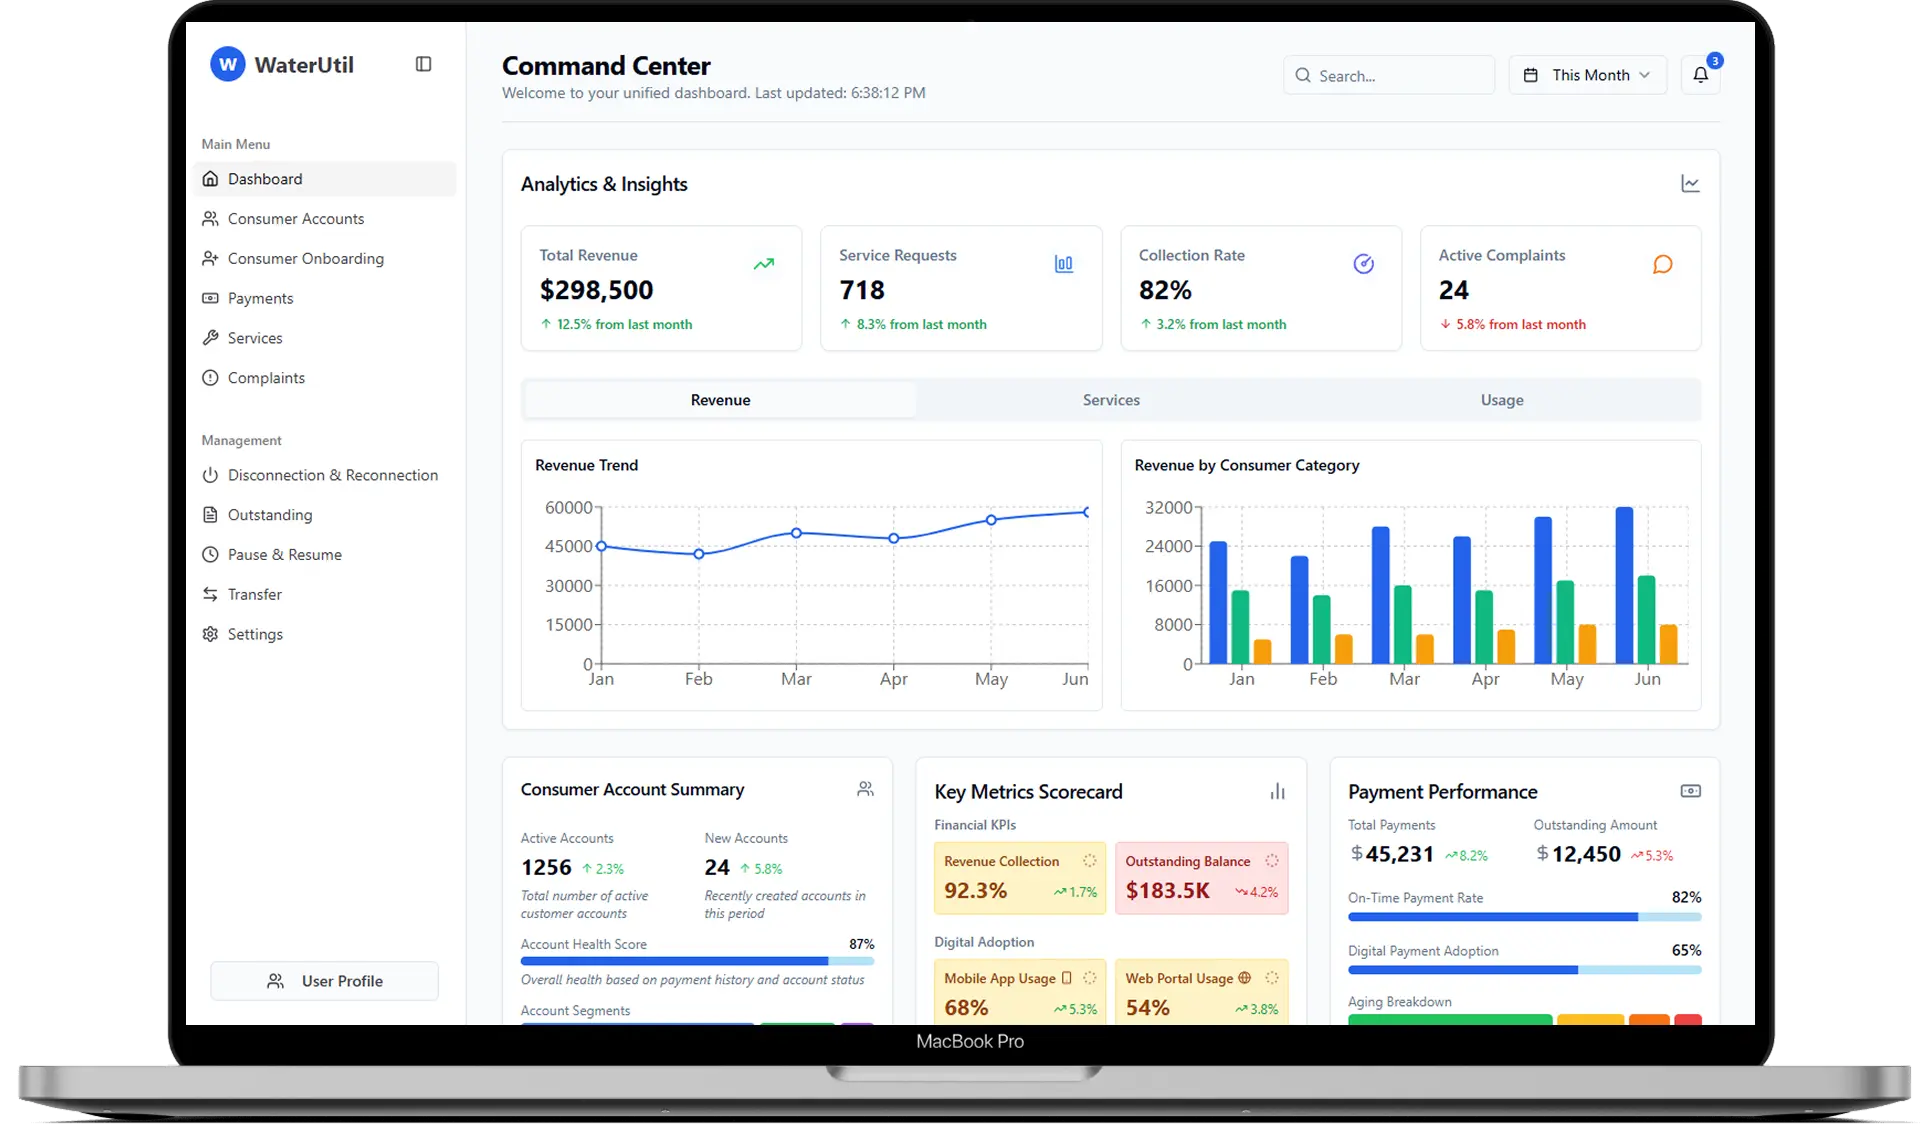
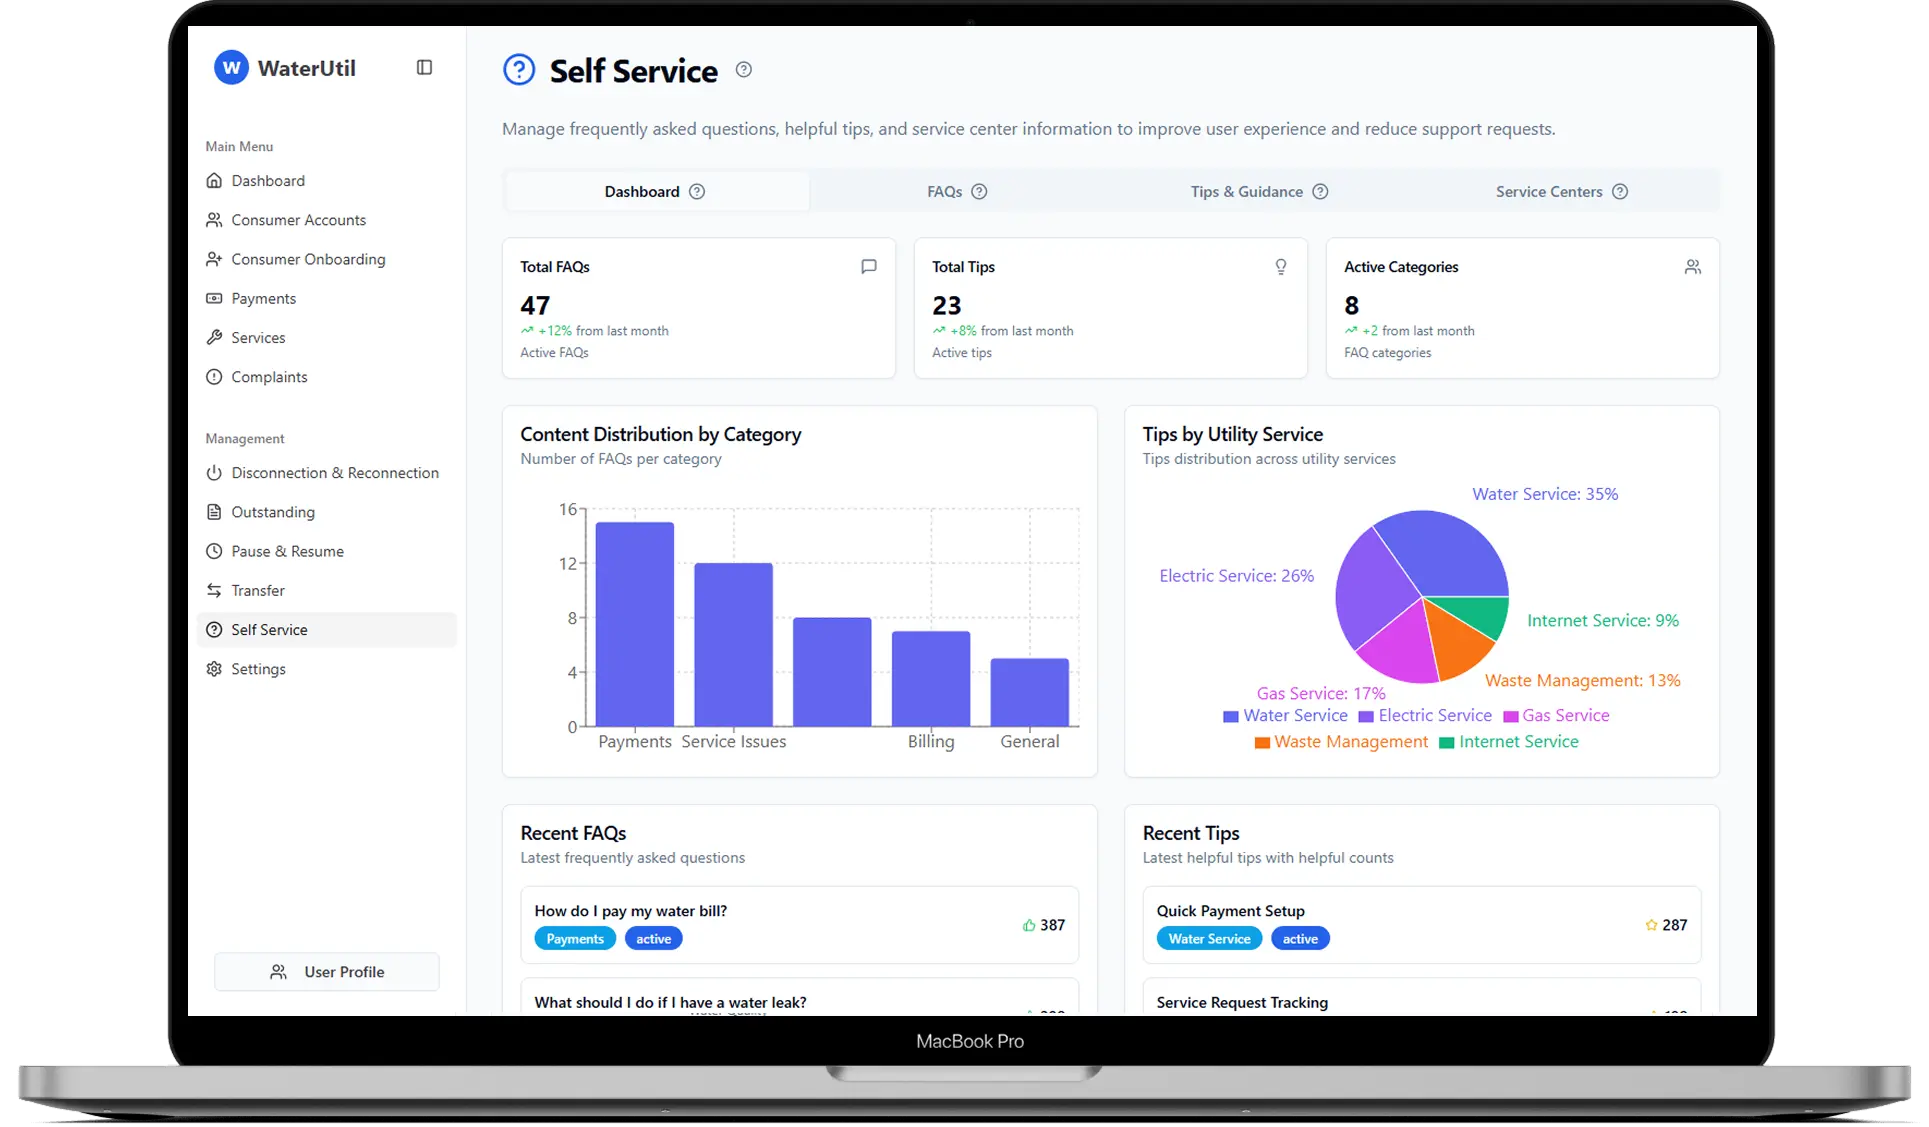
Utility analytics and reporting on one source of truth. SMART360 gives billing, operations, and finance teams at US water, electric, and gas utilities running 3,000 to 100,000 meters real-time dashboards that cut report-building from weeks to minutes, and end the meeting about which numbers are right.

Reads Processed In A Month
Less Billing Errors
Less Ops Investment
Built-in Integrations
Nobody’s numbers match. Monday meetings start with “which version is right?”
Analyst pulls data, formats Excel, emails a PDF. One filter change, and you start over.
Operations wants meters. Finance wants revenue. Everyone sees everything or nothing.
Pasted into PowerPoint last Thursday. Accurate for about 12 hours. Now it’s a decoration.
Two weeks pulling data, reconciling numbers, building slides, hoping the CFO does not ask for a different cut.
New connections this quarter by zone? File a request. Wait for IT, or the analyst, or whoever owns that spreadsheet.
Organize and scope reporting by team, before anyone builds a thing.
.webp)

A drag-and-drop builder for any chart, saved to a shared library.
Assemble charts and widgets on a drag-and-drop grid, scoped by department.
.webp)

Consumer and meter analytics out of the box, plus your own custom metrics.
Reports that deliver themselves, on the cadence you set.
.webp)
Size: 28,000 connections
28,000 connections. How a municipal water district modernized operations with leak detection, consumer engagement, and field service management.
Read Full Case Study ->What others are saying about SMART360


One login. Every report. Every department. Every board meeting. No exports, no tickets, no waiting.
Book a Demo Today